Activity
Area
Timescale
CDR potential

Science behind every decision. Explore carbon-removal projects, examine the evidence and plan towards your company’s targets.
Start exploring for free: Create a business emissions report · Watch a place you care about
Read a sample buyer briefing. No sign-up needed.
We’re building a planetary health platform. Connecting a view from space with action on the ground, starting with carbon removal.
Tao Climate OS
Explore the atmosphere, discover a place, follow climate action.
2025 global annual average
above the 1850–1900 baseline.
More intense heat extremes and heavier downpours. Drought and fire weather worsen in some regions, increasing pressure on people and ecosystems.
These are scenarios, not a forecast or inevitable milestones. Flooding, drought and wildfire risks vary by region, exposure and local conditions.
The reading is an annual global surface temperature anomaly, not today’s temperature or a local measurement. WMO reports +1.43 ± 0.13°C for 2025 and +1.55 ± 0.13°C for the record year 2024. A single year above +1.5°C does not establish that the Paris Agreement’s long-term warming threshold has been crossed.
The scenario buttons describe sustained warming relative to 1850–1900. The gauge always shows the observed 2025 annual value. Its +4°C upper tick is a comparison scale, not a physical ceiling. Future warming depends on emissions: limiting it requires net zero CO2 and strong cuts to other greenhouse gases.
WMO: State of the Global Climate 2025 · IPCC: physical science · IPCC: impacts and risks
Satellite observations · Regional context
Select a place on the globe.
Use a map selection or your device location to explore.
Sign in to save private places and open their satellite views.Device altitude is shown when available after you choose Use my location.
These are global likely ranges relative to 1995–2014, not a forecast of flooding at this location. Surface elevation and device altitude cannot establish whether a home will flood. Tides, storm surges, flood defences and local terrain need a separate assessment.
NASA regional projections ↗ · Irish OPW flood maps ↗ · IPCC source ↗
The globe visualises modelled column-mean CO2 concentrations in parts per million from the Copernicus Atmosphere Monitoring Service (CAMS), operated by ECMWF. This is an atmospheric forecast, not a direct map of emissions or a measurement of project removals.
Explore the CAMS sourceCopernicus Sentinel-1 radar and Sentinel-2 multispectral observations help us monitor land conditions and vegetation through time. Google Earth Engine connects these observations with project boundaries, dated imagery and supporting land-cover analysis.
Explore ESA and CopernicusNature-based approaches are a critical part of the climate response, alongside deep emissions reductions and other removal pathways. Tao connects satellite monitoring, supplier evidence and transparent carbon scenarios. Biomass, end use, permanence and lifecycle emissions determine the removal that can ultimately be supported.
Explore the modelling approachExplore partner projects and proposed programmes. Live activity, modelled potential and funding concepts are clearly distinguished.
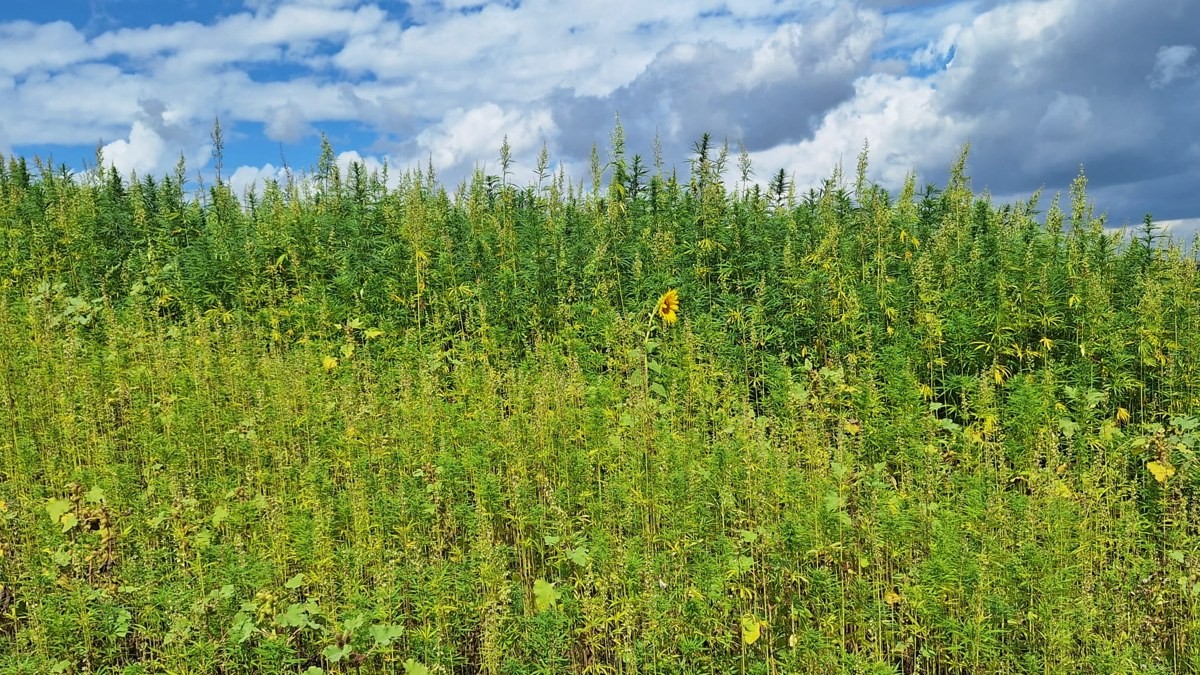
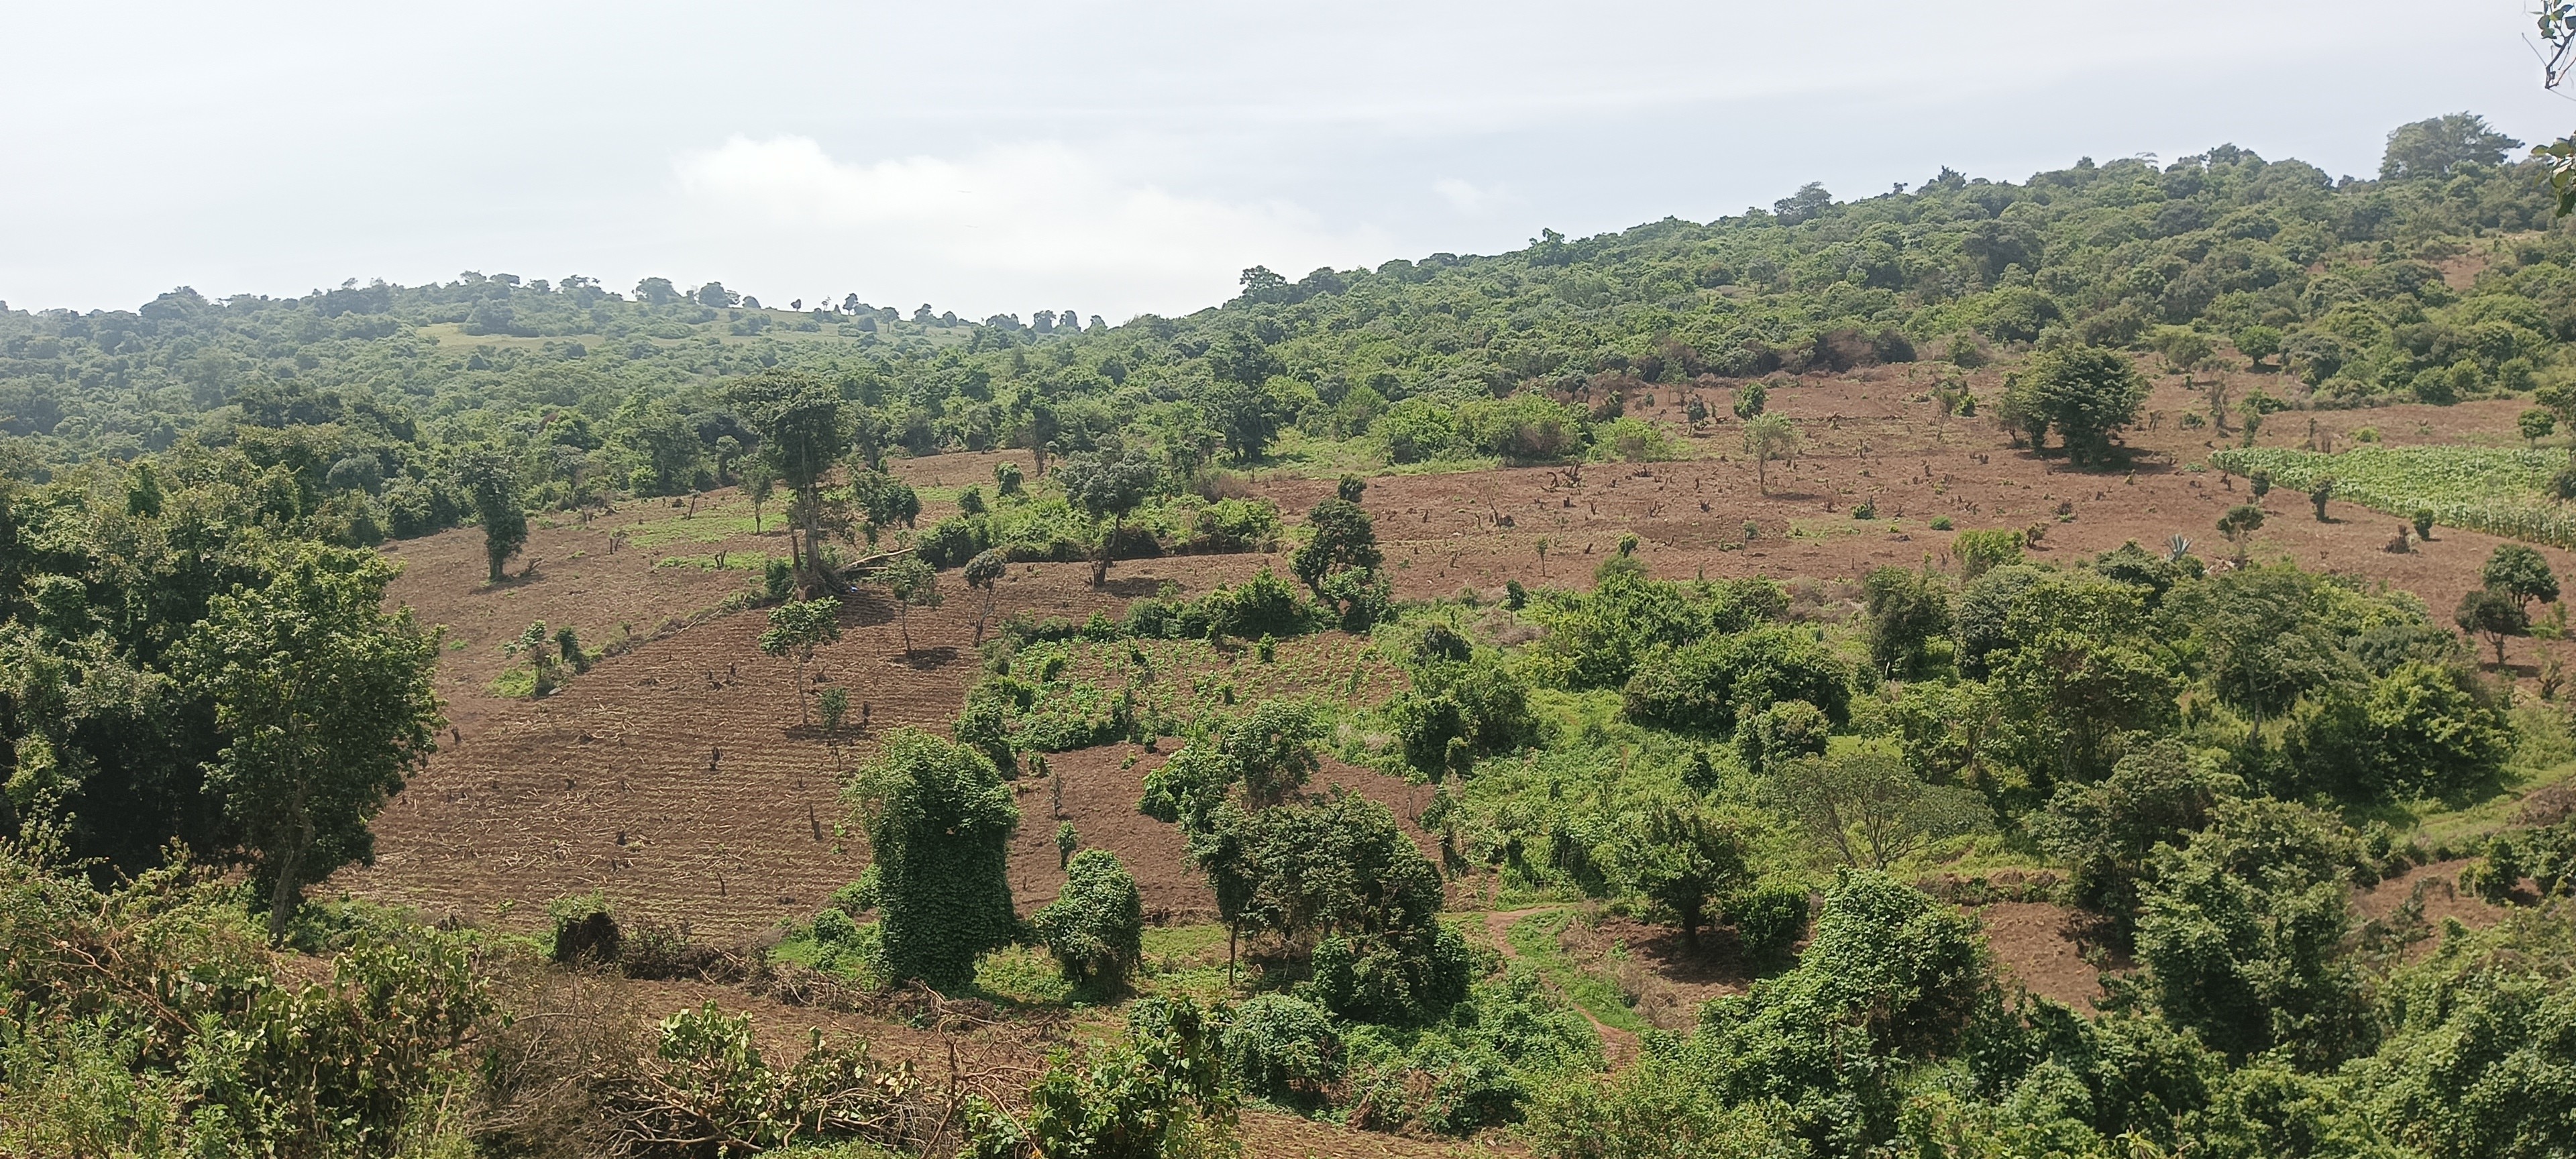
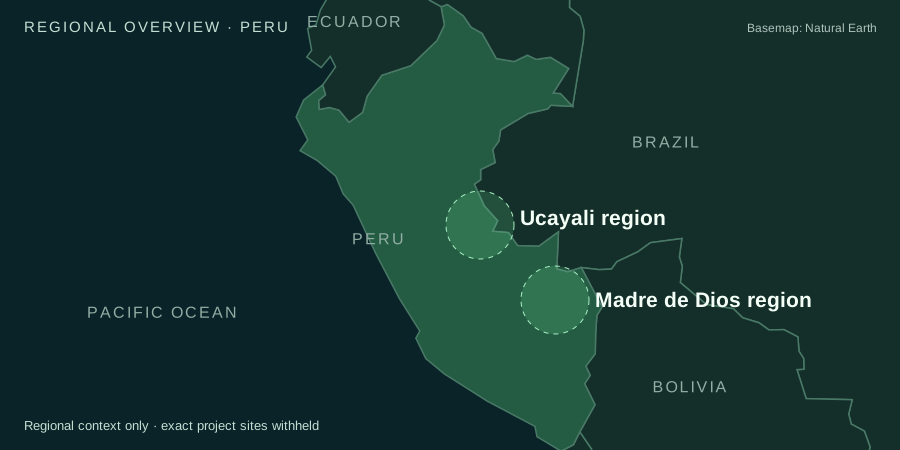

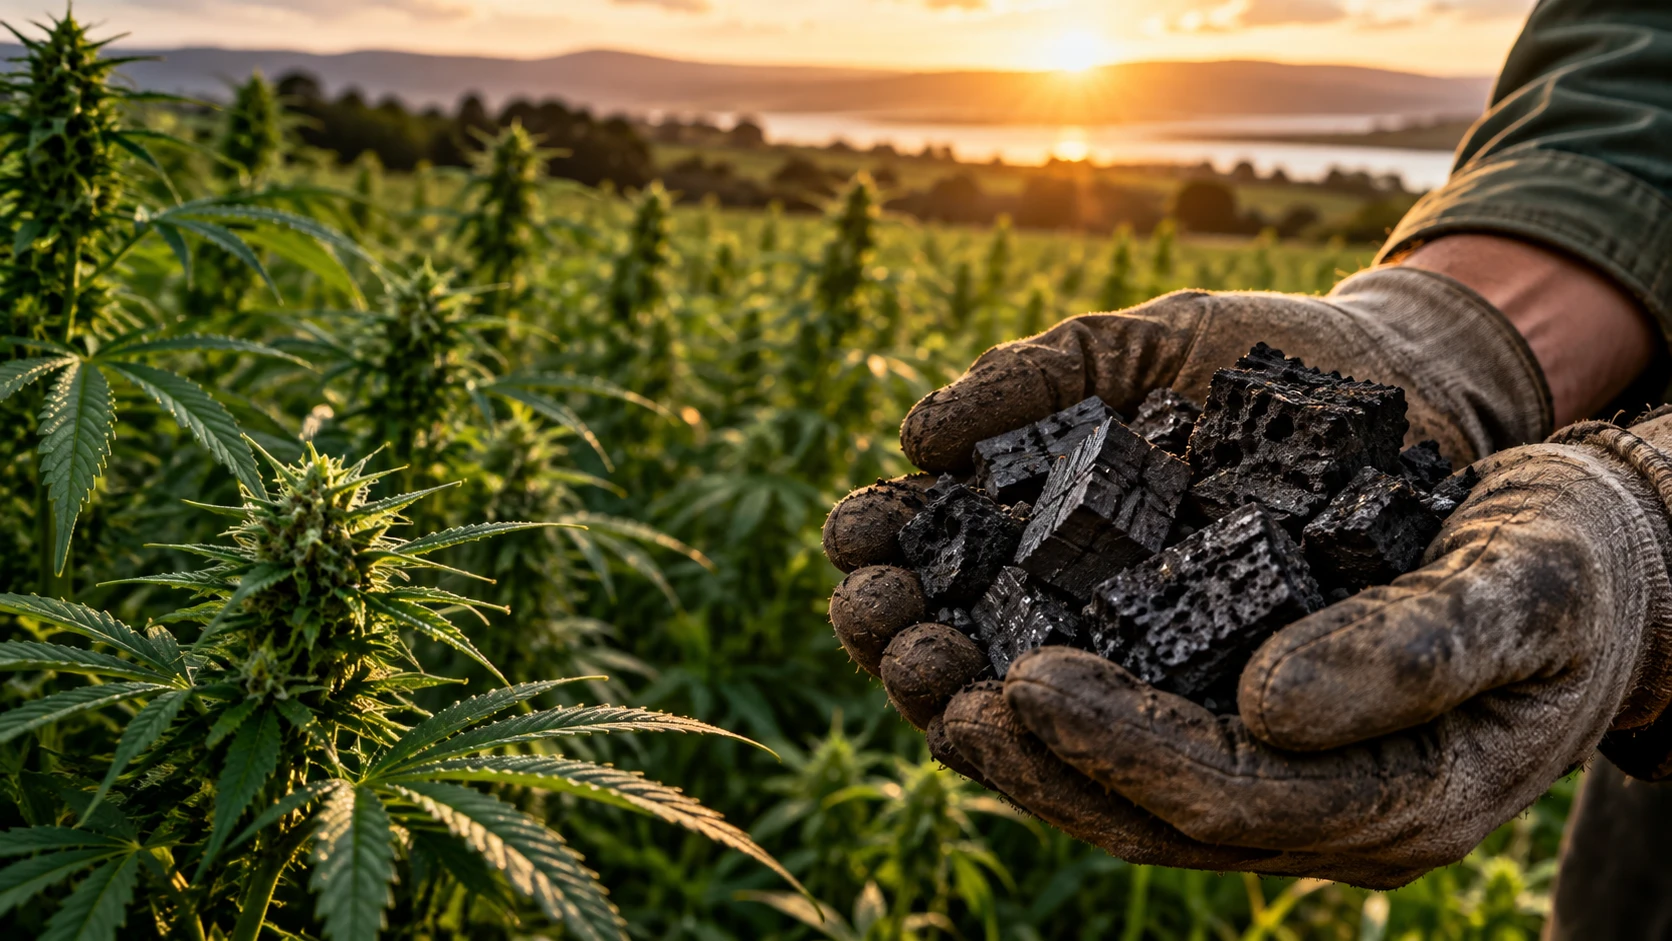
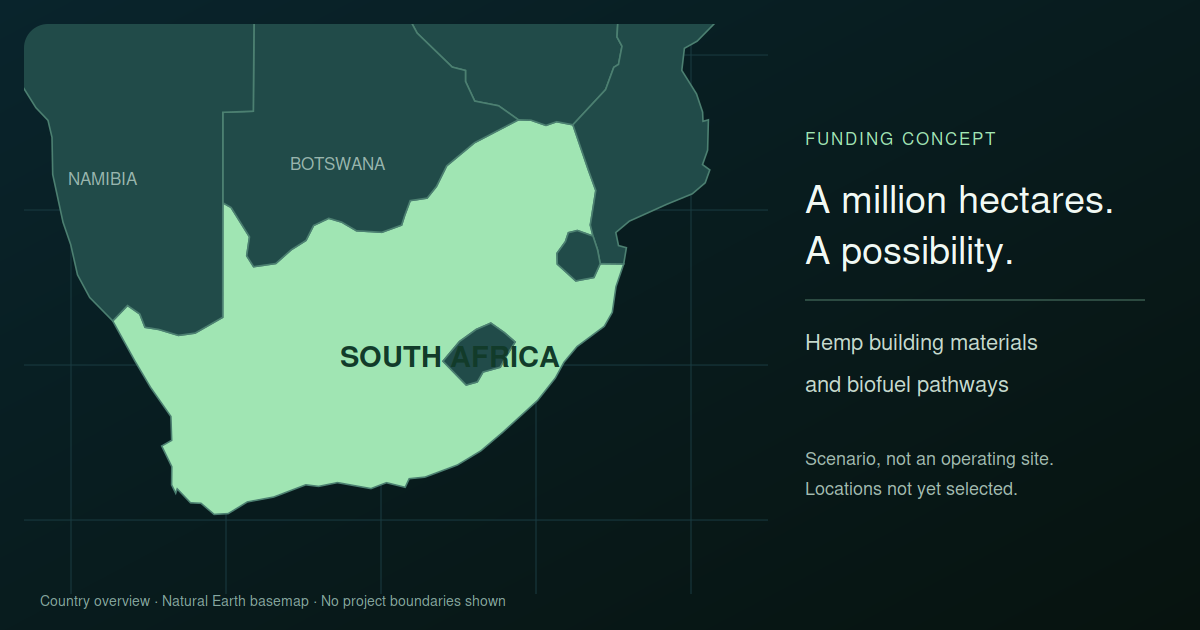
A transparent view of potential across the portfolio. Projections remain distinct from achieved removal.
90,666.7 t CO2Modelled potential · Tanzania, 20-year horizon
200 t CO2eProvisional potential · Moldova, 2026 crop
Net removal unverifiedDifferent project horizons are combined, not annualised. Emissions and deductions remain incomplete.
Public summaries protect partner identities. Country markers are illustrative. Modelled potential is not verified removal; concept figures are excluded from portfolio totals.
Explore our existing products. These links connect the experience today; shared data, workflows and access across the wider platform are the next phase of development.
Explore global climate intelligence and the wider carbon picture.
Open product ↗Put aviation climate intelligence into context.
Open product ↗Follow fossil fuel prices and the energy transition.
Open product ↗Air travel carbon footprint removal, embedded into the air travel experience.
Open product ↗Measure the carbon footprint of the AI used to calculate any flight’s carbon footprint.
Open product ↗Save your carbon calculations, revisit your results and continue where you left off in your private workspace.
Explore the public tools without an account. Sign in when you are ready to save.
Observations show dated satellite data. Models depend on stated assumptions. AI interpretations need source checks and human review. Independent verification requires an actual assessment; it cannot be inferred from an image.
Show me the evidence checklist · How we use AI · Methods and limitations